
Maps
This data resource is part of SRL’s larger mission of promoting mutual aid within research and knowledge communities.
We invite you to submit any data you have that may benefit other researchers, Long Term Recovery Groups, policy makers, and groups engaged in rebuilding.
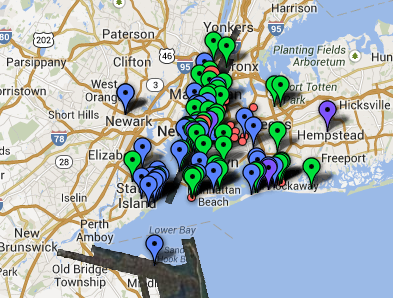 |
Google Crisis Response Map. Last update January 17, 2013. Including: Emergency Alerts, Post-Sandy Imagery, Damage Assessments and Power Info, FEMA Disaster Declared Areas, Main Distribution Hubs, Shelters and recovery centers, Red Cross shelters, NYC evacuation centers, and more. |
 |
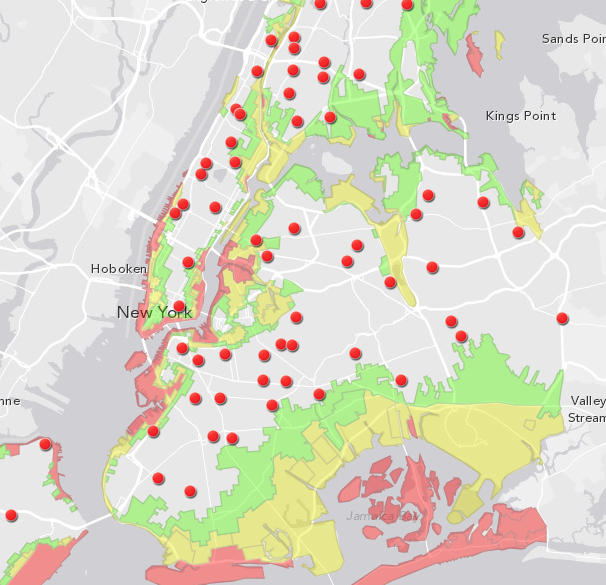
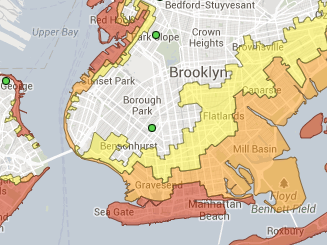
Pratt Institute maps of vulnerability. The residential maps document the number of homes directly affected in Coney Island and the Rockaways, and show how vulnerable many residential neighborhoods remain to future storms. The NYCHA map, in particular, illustrates the storm’s disparate impacts on low-income New Yorkers. |
 |
Esri maps. Including: Sandy Election Impact Map, Demographic Impact Map, Hurricane Sandy: The AfterMap (before and after areal images), and a Photo Tour Map. |
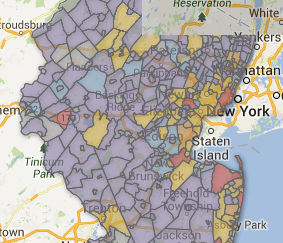 |
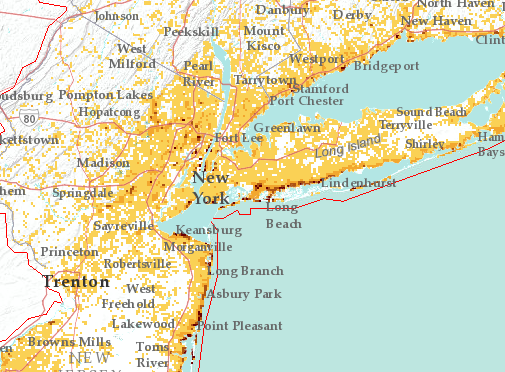
Estimated number of residences damaged by Superstorm Sandy in New Jersey. Calculated by cost of damage. April 2013. Source: New Jersey Department of Community Affairs. |
 |
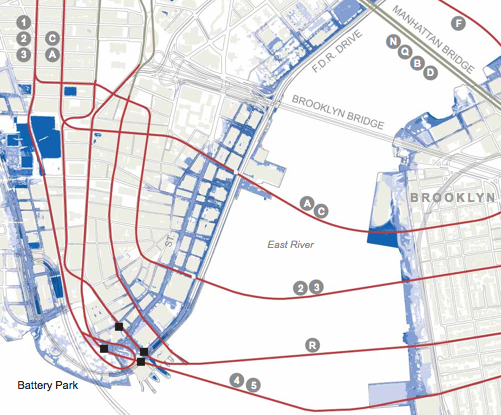
NYC Evacuation Zones. Includes: NYC Evacuation Centers, NYC Evacuation Map, Storm Surge. Street Basemap, Topographic map, and Photos from Flickr filtered by: “#flood OR #surge OR #damage.” |
 |
New York Times’ interactive map of evacuation zones and emergency shelters. Including: addresses of Evacuation sites and emergency shelters by borough and an address search. |
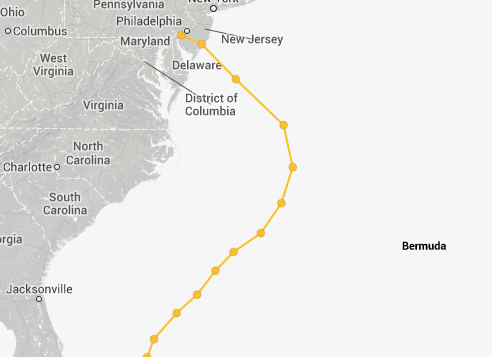 |
New York Times’ storm-tracker map. Last updated October 29, 2012. Shows location of Superstorm landfall. |
 |
New York Times’map of Sandy’ s aftermath and early recovery efforts for infrastructure. Includes: Subways and buses; Power Failures (time lapse); Tunnels, Trains, and Airports; Wastewater; Flooding; Fires; Wind. Interactive. |
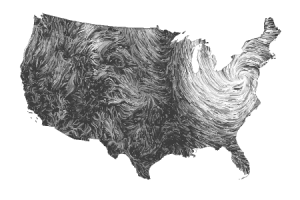 |
Wind map by Hint.FM. Has current windmap for United States, as well as an archive for Hurricane Sandy on October 29th and 30th. |
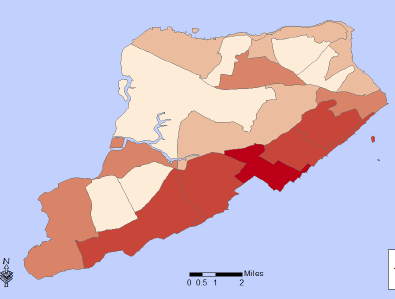 |
Staten Island Damage Assessment Maps. Superstorm Sandy FEMA Damage Assessments on Staten Island: Number of Homes Affected; CSI, CUNY HPCC. |
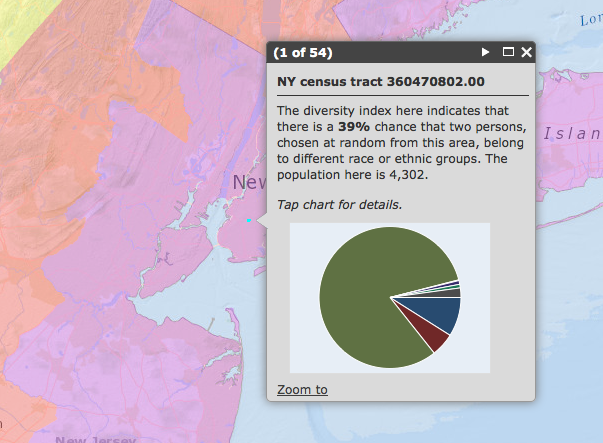 |
Ersi Sandy impact and demographic map. Demographics: Over 64 years of Age, Home Ownership, Median Home Value, Household Income, Diversity. Uses Census data. |
 |
FEMA food distribution and availability map. New York City and Long Island. Last Modified: July 22, 2013 |
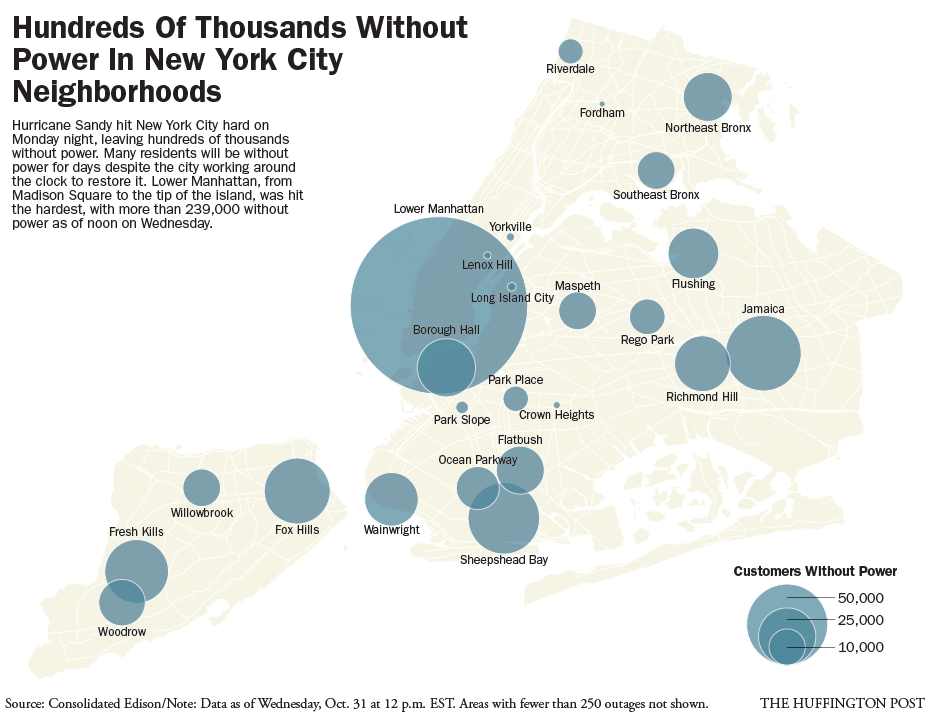 |
Huffington Post map of power outages in NYC and other states. Using Consolidated Edison sources. Data for October 31, 12pm EST. |
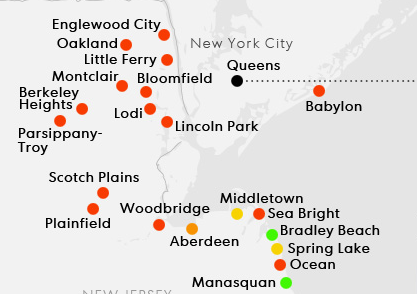 |
USA Today‘s Map of Poor Flood Preparation ratings given by FEMA to Sandy affected areas. |
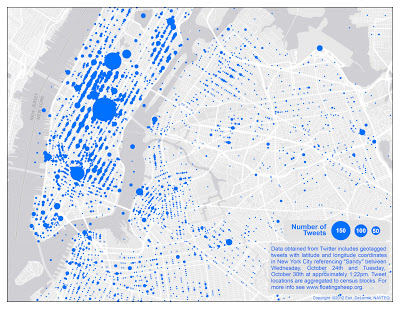 |
Floating Sheeps’ geotagged tweets from October 24- October 30. #Sandy. |
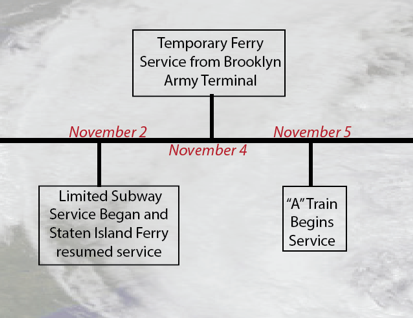 |
Timeline of regional transportation recovery in aftermath of Sandy on Staten Island. To December 3, 2012. By CSI’s Afrona Kaziu. |
 |
Aerial imagery of affected coastline from NOAA’s National Geodetic Survey overflights. October 31-November 6, 2012. |
 |
NASA Earth Observatory images and visualizations of Hurricane Sandy. October 23-November 1, 2012. |
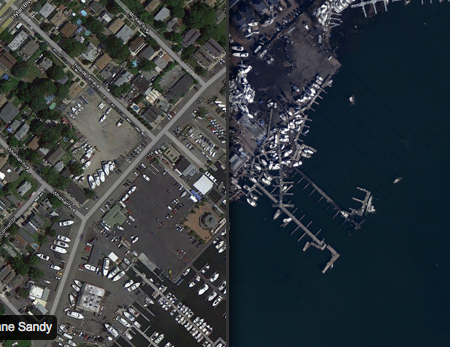 |
Before and After slide bar images from NOAA’s National Geodetic Survey. Last updated. November 7, 2012. |
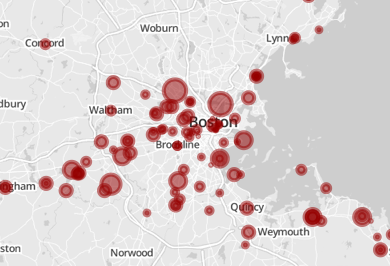 |
Boston Globe incident report map of Hurricane Sandy on Boston using social media via geotagged photos. |
 |
Social Vulnerability Map by the Hazards and Vulnerability Research Institute, University of South Carolina. Based on data from 2010 Social Vulnerability Index. |
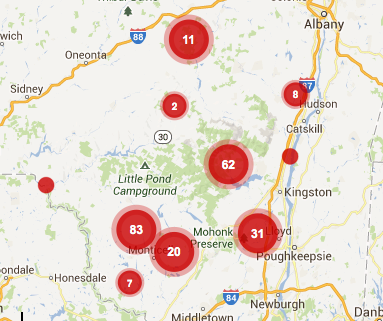 |
Hurricane Sandy in the Catskills. From Watershed Coverage. Coverage area is roughly 5-counties. |
 |
FEMA’s Best Available Flood Hazard Data. Last Modified: July 18, 2013. |
 |
FEMA’s NFIP Flood Insurance Policies In Sandy Affected Areas.Count of policies within 1km grid cells. Last Modified: December 3, 2012. |
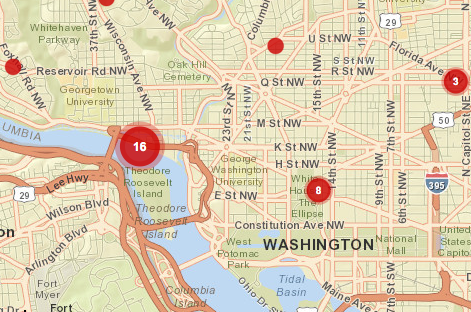 |
CrisisCamp DC’s Crowdmap of Sandy in Washington DC. October 27-November 20, 2012. |
 |
Crowdmap of Hurricane Sandy Communications: “Tracking and visualising communication network outages and recoveries.” October 30-November 24, 2012. |
 |
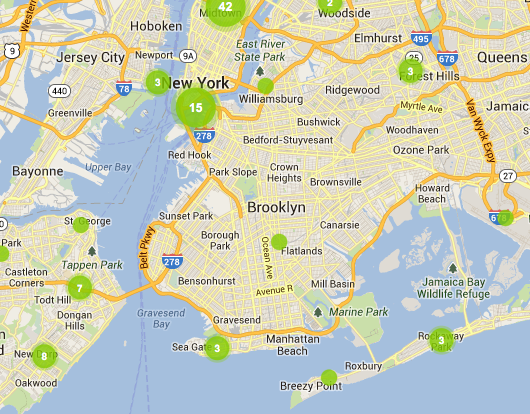
Crowdmap of Hurricane Sandy Coworking spaces: “a map of area business helping each other out. Here you will find locations to work, recharge, and reconnect.” NYCEDC verified spaces. October 31 to November 20, 2012. |
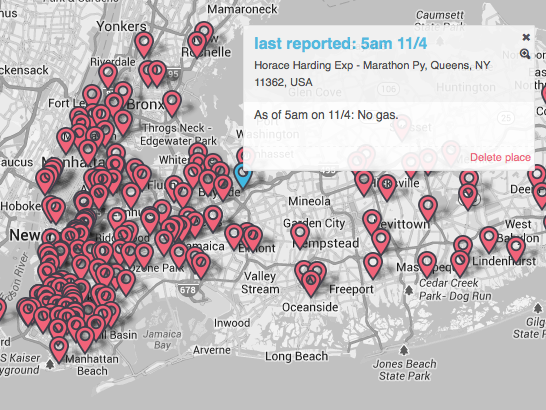 |
Justmapit NYC Gas Map (#NYCgasmap) showing crowd sourced information on gas shortages. November 3-6, 2012. |
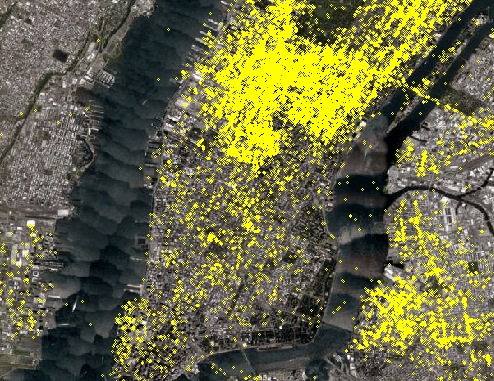 |
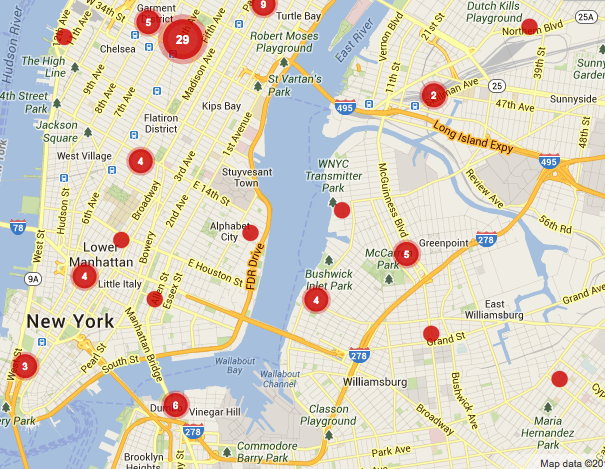
A time lapse of Foursquare activity in NYC during Hurricane Sandy. Lower Manhattan. October 29- November 2, 2012. |
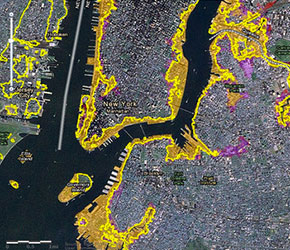 |
NOAA Sea Level Rise Tool For Sandy Recovery. Last modified: June 20, 2013 |
This data resource is part of SRL’s larger mission of promoting mutual aid within research and knowledge communities.
If you use it, we invite you to submit any data you have that may benefit other researchers, Long Term Recovery Groups, policy makers, and groups engaged in rebuilding.
No comments yet


