
Interview with Organizer for OccupyData


Interviewer: Max Liboiron
4/22/13
Q: Alright, so because you’ve sort of agreed here to have your name and affiliation recorded for now, which you can redact if you want, could you state your name and the affiliation that you had sort of working through Sandy?
A: Sure, my name is _____, and I am a— I organize some events for Occupy Data, and recently we acquired some data related post-Sandy and up to almost current date, so that’s what I’ve been involved with.
Q: Okay. So, so can you tell me about how Occupy Data sort of got involved in Sandy and what it’s been up to since Sandy hit?
A: Sure. So I guess to start we had a spring hackathon, which was early March.
Q: Some tweets, yeah. [laughter]
A: Yeah I mean I was sort of I—I’m from Staten Island, so I’d actually gone to volunteer, but I was sort of hit with a rather— the volunteer process was a little bit much, and I actually just decided to go down there on my own and do what I could. But, I guess, you know, I was interested in the data all along, especially the canvassing data, which I had seen some of the canvassing forms, and I actually— I’m in contact with, the like a street medic community so— and they’re all over the US, so I had also seen a bunch of e-mails- where– I knew you know— so I was sort of aware of some of the medical issues, especially with you know the lower east side, and the and it’s a New York Housing Authority Project’s over there, and so I, you know, I could see that there was definitely a way– you know this data was being generated that could point at— it could either be used for advocacy or just to characterize, you know, most immediately just characterize just the extent of what was going on, so yeah I had always been interested in collecting it, and about— I guess it was just prior to the hackathon where I became more proactive about it. We had actually had a discussion about— so we typically pick like a data set or two to focus on, and it just seemed like a good idea to do something Sandy related.
Q: Mhmm, at the hackathon?
A: Yes.
Q: Yep.
A: So I had spoke with— I don’t know how I immediately got into contact with Drew. I actually don’t even remember. But you know, eventually he was the one that I met with that— he made a call out to a bunch of the different hubs and had them send— I think he actually had a form where people could sign up and say what type of data they had, which we only got a small picture of it. You know some people, some places were, and rightfully so, concerned about privacy issues. Also a lot of it hadn’t been—you know it was just paper, so we even said like we’ll enter forms, like I think something like a hundred forms from the Rockaways and you know probably a little over a hundred from one of the sites in New Jersey. So things were at just various stages— were at various forms, but we rounded up what we could get, and I think it was one week to that, prior to that. Well, we knew it was– well, the data was not looking good, and it was also— a lot of it hadn’t been digitized, so you know. And I knew it was International Open Data Day, so I had proposed that we look to just saying like you know “we’ll do this in coordination with Open Data Day” and really the idea was to prepare everything that day for, you know, releasing it to the public. Although it was harder than you know— the data was pretty— well, I think the thing is, a lot of the way data was collected, various formats, you know various granularities, it wasn’t standardized, so even in common boxes you could have somebody putting somebody’s phone number, that type of thing. And, you know, I do work with— I work with data — medical data, and I know that that type of information is sensitive. Maybe it’s not necessarily a security issue, but you know it can certainly be sensitive, so I— it’s— I think it’s to the point now— it’s where, we’re actually meeting on Monday to look at some of the data. I think we’re just going to make sure every single record has nothing personally identifiable and then we will, we’ll post it and make it public. I would’ve like to have—so we have another data set where we were able to merge to find the—so the I think there was maybe four, four canvass—four different sites. Should I talk a little bit about the data?
Q: Yeah. Sure.
A: Okay so Staten Island, New Jersey, and the Rockaways and Red Hook— so these were the four sites that we received data from.
Q: And did you mostly receive the data from canvassing or, like—
A: For the canvasing data [Q: Okay] there’s actually other types of data sets that I think are very interesting: like food— there’s one on all different foods that were ordered from this one hub— I think it might’ve been the Bay Ridge, the kitchen in Bay Ridge or something, but there’s something like a few thousand meals or something. And you know there— there’s a variety of— I mean I think everything’s interesting like, even forms people have or you know flyers people produce and, you know. So I should say actually the first— my first glance at this data was being invited to the Occupy Data Google drive folder, which is nebulous [A laughs]. And I think that was my first glimpse into just how fragmented and disheveled I think things were— like a lot of, you know–and they know I’m sensitive to the fact that no, obviously the first priority like immediately post Sandy isn’t making sure all of your forms are standardized, and you know everything’s well organized. And you know things are coming in, and the form is growing and changing as needed, so you know. And there were people sort of started things and dropped forms so there were a lot of these abandoned forms, and I remember I even started to categorize some of the stuff. Like, I think one of the categories was like probably “junk” or something like that and it had like a whole bunch of links— so even just making sense out of that. But there was, like I’d say the data that was collected that I thought was interesting were some of these, you know, things like resources, utilization of different services, there’s some volunteer information, there’s— I think this got a bit jumbled. There was medical infomation reported, but at various levels of detail that ranged from specific needs to nothing at all. Also, another concern I was trying to express is the data we have access to is only a fraction of the Occupy Sandy relief effort. From what I was told, a good deal of the earlier data does not appear in the files we had access to. However, in the case of the Rockaways, the contact there gave some us paper forms with earlier canvass data that one of the volunteers entered. Also like locations, like partnering organizations were listed, you know, and there was people’s contact information that sort of information—that sort of stuff. Yeah I think that’s—and definitely like organizing documents. There was one thing I thought was so great. It was like, it was the Rockaways, which actually had a pretty good handle on their data, so it seemed like— so they had used Google Fusion Tables, so like one issue, which a lot of the sites still have, like even a report that says who— what residents don’t have heat right now, they’re unable to generate that. But this had one– It had you know it had a fusion table, with everyone that was canvassed. You could actually—the fusion table you could— one of the maps is the map view, so you could actually see where these locations were. Also with the fusion tables you can create different views of the table, so it’s not like— say if I were to—any volunteer comes in one day and needs to update some information, you don’t have to give them access, or let them view the entire like, you know, all of the information at once.
Other issues were like consistency with the reporting, which— well you must be familiar with survey research right? [Q: Mhmm Hm] I think this got a bit jumbled. There was medical infomation reported, but at various levels of detail that ranged from specific needs to nothing at all. Also, another concern I was trying to express is the data we have access to is only a fraction of the Occupy Sandy relief effort. From what I was told, a good deal of the earlier data does not appear in the files we had access to. However, in the case of the Rockaways, the contact there gave some us paper forms with earlier canvass data that one of the volunteers entered.
Q: Right.
A: So all of these kind of really messy real world data issues.
Q: Mhmm. Are you in conversation with people who made the forms to try and figure out how to how to do some of that mapping?
A: We were. So, actually, like Rockaways we were, so they had actually brought us the– you know I, I forget her name— I do remember her name Katie actually.
Q: Mhmm.
A: Do you know Katie?
Q: I don’t think we’ve talked to a Katie.
A: I can give you I’ll pass I’ll pass along her information.
Q: That’d be great.
A: You might have to remind me though.
Q: Okay.
A: But I think they are defunct because they lost their space, so they’re not operational anymore, but she was essentially, like, running (the canvassing operation for) one of those hubs out there. But that was definitely one of the— I actually think that maybe some of the problems with the forms were that there was disconnect between the people actually using them and the people designing them, but I kind of think that some– in these iterations you would sort of see things like resolve themselves, but like one form I think Staten Island, I couldn’t imagine somebody—you know they must’ve conducted, they would’ve had to of conducted like at least an hour interview [Q laughs] to get like all of these. And, and maybe if you’re sitting in an office and you think like, ‘oh well this information could possibly be useful’ you more inclined to add too many questions.
Q: As an individual question?
A: Yeah.
Q: Right.
A: Which I think some were getting around that by more check boxes. But like I’d say, like a good form that I saw was the Rockaways, which I think they sort of compartmentalized it too into the basic things. So like if somebody didn’t need something, they wouldn’t necessarily have to go to that area but it was like demographics and then like immediate needs, like you know more household stuff, food, and then legal, and then like house and repairs, so— maybe I wonder if I could— do you have access to these assessments?
Q: Not yet. No.
A: Okay.
Q: Eventually we assume we’ll be partnering with Occupy Data and hopefully do some sharing of information—
A: Okay. Yeah, yeah that sounds. That sounds feasible. And yeah I don’t think that— and I think some of them will even have like blank so—you know.
Q: Okay.
A: A lot of them we just—even people brought them in and, you know, they took them with them. So you know although we have the fields, they weren’t, they’re not exactly as they appeared on the form. But some of them we actually have the assessment, which actually I was able to find some of them in the old, in that Google folder too.
Q: Oh, okay. Excellent. Alright, so you’ve just given me a lot of stuff to work with, so I’m going to back up, and we’ll like sort of clarify some of the stuff that you mentioned. So first you said that you live on Staten Island.
A: I grew up on Staten Island.
Q: Okay. You grew up, but you’re not there anymore?
A: No.
Q: Okay. Is there area where you live—was it particularly hard hit?
A: So my street no, [Q: Okay] but where I wrote was being used as a shelter, and I live very near South Beach which was hard-hit.
Q: Okay. And when you first did the volunteer work where you went to Staten Island. You went to Staten Island to volunteer, or?
A: So I had actually, so I was only in New York for a little while, so I figured what might be good and I, I had—was staying with my mom. I had my mother’s car, and she had a station wagon so I thought ‘oh, I’ll be a driver’ you know, [laughs] so I went to—I didn’t go to— I knew there were a lot of things coming from Brooklyn to Staten Island and I don’t think Staten Island had a— I think I actually first went to that Staten Island Recovers and put my volunteer information there, but I didn’t hear anything, so I just went to the volunteer intake in— in I think it’s like Clinton Avenue.
Q: Yeah.
A: It was on Clinton Avenue.
Q: 520 Clinton Avenue. Was it like when the Occupy hub in the church?
A: Yeah. Yes. Which I think– they were conducting the orientation, but I think the thing was they were, you know, it’s like the— it was for essentially everybody that was volunteering where, you know, you know I wasn’t canvassing I wasn’t doing this you know it just seemed… Well anyway I got into the database there and then I got this phone number, so I actually did get asked to come and deliver something, and I came all the way out to Williamsburg, and then about ten minutes before they’re like ‘Oh! You know if you’re there like don’t bother. [laughs] We already got it!’ I was like— and it was the day that it snowed.
Q: Oh yeah.
A: It was like that evening, so I was like ‘oh great’ you know. So then I just— I— the next day I just went down to the one in New Dorp Beach.
Q: Okay.
A: So, you know.
Q: Okay. So you sort of, after some shenanigans with the station wagon, you sort of went to the data immediately is that —
A: Oh no, no. I— I went to— I just went to— this was nothing to do with data at all.
Q: Oh, okay.
A: I just went like to lend hands, kind of—
Q: Okay
A: and bring stuff. Cause I kind of think at that point— I don’t even know if people were— I really don’t even—I had no idea what was going on with all of that. I didn’t see any of the data collection or anything like that so.
Q: Do you think your experiences volunteering on the ground have influenced how you’re looking at the data and how you understand it?
A: [long pause] Well, I think maybe my experience seeing how it affected my community around me where I grew up made, makes me think about these things, and also, you know, I have experience working with data from geriatric patients, and people with medical needs, so I think that also was something that influenced: one, what I thought might be interesting to look at but, also you know, the issues of people with outstanding medical needs and also just seeing like the— they’re not the Occupy medics. It’s more of like, like a national street medic community. Community health worker community. But they were doing their own sort of assessments and I would see these, you know, through the e-mail, they would do like a roundup of the day. So just seeing some of that kind of— like knowing that people needed like diabetic needles that, you know, these types of things or that people were new— needed medication like homebound patients needed medications but were unable to get them, so I, I was kind of looking for some of those things in the forms.
Q: [Q’s phone rings] Sorry. Goodness. [A laughs] It’s a new phone and I don’t know how to use it. Like this. Done now. [A laughs again]. Theoretically. Okay. I finally joined the twenty-first century and got a phone that does all the fancy things and I– [A laughs] it’s too fancy. Okay. So, how you— have you worked with this street medic community before? Like, were you already familiar with them?
A: Yeah, so I’m actually developing some materials and run a private wiki for them at streetmed.org. We’re developing some materials for the public –it’s actually at street medhandbook.net and then we’re making a mobile app I got involved with them from— I’m at CUNY and we’ve had some issues with increasing tuition and, you know, there was a lot of— and you know just our board of trustees that like sort of surveillance of Muslim students and all that. So students were very upset. We have our own GA and, you know, there were some actions planned, and we breaked— we broke up into different groups and I was on a medical/mental and medical support, so you know, just trying to find resources for things, there were just so many different things to pick from, and it’s hard to tell what’s credible or not so, you know, I started to talk to these medics. They actually did a— so the one in Chicago had actually arranged for an affinity group training at CUNY.
Q: Nice.
A: But I know that they had this handbook, and you know like I had asked can we— it would be great to have these resources available to people, because you know the— like what’s commonly used is a black cross, which is, like, over ten years old now. And then things vary by location, and you know everything’s kind of scattered, but there’s things in there that they felt were sensitive like cultural things or also you don’t want to give people a false sense of empowerment like ‘oh yeah I have this handbook like now I’m a street medic’ [Q laughs] you know?
Q: Right.
A: So you know I’d say over, well probably over the last two years now, I’ve been working with a few of them to kind of put out some of these resources and really it is, you know— they want people to be better trained and they also, there’s sort of a shortage of street medics so also to get like more people involved and, you know, but the idea is to actually create one resource for them which actually has their full handbook that’s like—like right now, they develop all of their materials on this private wiki so there’s definitely this like keeping their own stuff but putting, pushing out what is appropriate for everybody.
Q: And, I’ve heard a lot of people wanting that sort of stuff for like for future crises, right, wanting that kind of handbook— is that sort of part of the impetus behind it?
A: Oh, well I definitely think like, you know, for example, like I remember they were sharing— there was one part of it on — I think there’s a whole chapter on like cold weather or something like that? You know even just hypothermia. And there’s just basic tricks— it’s really just for you know it— it can be for actions or it can just be for low resource environments so, you know a lot of them it’s just like practical advice to kind of keep people prepared. You know, there’s getting into more first aid, but you know a lot of them are licensed— you know a lot of them do practice, but yeah I think just keeping people informed for a variety of situations where resources are scarce and you may not necessarily be able to rely on more formal care Also, attracting new people to the community.
Q: Mhmm. Do you think some of the stuff you’re doing with Occupy Data and the hackathons will also go that way where it can be used in the future for other sort of disaster or issues or is that not something you guys think about?
A: Well, you know I kind of— I initially thought the— I can’t— so I should say the yackathon, so one of the topics I put up there is disaster capitalism.
Q: Oh yes, I saw that.
A: Yeah.
Q: Yeah, I liked that one.
A: [both laugh] I’m not on Facebook or I would’ve liked it too.
Q: Well it’s on the, on the yackathon thingy you can like, like you can give points to certain topics that you would also like to have. It’s basically a like button I don’t know if it was called a like button.
A:
Q: Right.
A: So I hope it doesn’t devolve into all of the meta-hackathon or something, but [both laugh]
Q: Only one-way to find out right?
A: Like “what is a hackathon?” So.
Q: Right, yeah. Okay so let’s— so one of the questions that, sort of we’re looking at and many people are looking at overall is how inequity was exacerbated from the storm. Could you talk about how that may or may not be coming up in the data or your other experiences?
A: Oh, could I just go back to—
Q: Oh, yeah.
A: I just wanted to say that— so one idea we had was to actually you know if, you know communities needed this like to actually help them build a tool, you know we were interested in helping to, more of this like, creating an information system
Q: Like a— like a handbook.
Q: Right.
A: You know you got to let it evolve into what the person is— like a lot of people are volunteering. Do you really want to force them to like learn your new tool?
Q: Yeah.
A: Like maybe standards is a more abstract way of having some kind of cohesive thing to pull you together, like you know we can share. Like it should be first name, last name and date, you know, and then like we’ll have– Like Rockaways it had— it was like made into five different things and if people could just— you know everyone had their own specific needs, but there were like some broader, general things like electricity, water, food— like that could’ve been uniformly tracked. But there just seemed to be disconnect, and also conflicting interests. But computer people and data people are like that, [Q laughs] you know, like we feel very—you know we’re passionate about our tools, but which I think can come into conflict when you bring the whole human element into the picture.
Q: Mhmm. I did speak with one Occupy Data person who said who, who was sort of talking about this exact issue was like “well maybe we shouldn’t think of like ‘tools’ maybe we should think of a best practice guide” or by like these are the things that will come up and have to be met and however you jerryrig that with what you have. Like if you don’t have electricity, obviously you’re using paper. We’re not going to tell you to use like [A laughs] pro-tools if you have no electricity. So here’s the best practices guide. Fill it out as you will. Right? That sort of, yeah.
A: Yeah, I agree. some recommended practices or something.
Q: Right.
A: And I kind of think in there should be like some like a data model, just a very basic data model. Because people don’t follow something as simple as ‘don’t put first name and last name in the same input field.’
Q: Yep.
A: Which can be, you know— or maybe if everybody, if you’re canvassing everybody on Staten Island, do you really need to have a field for the state?
Q: Right. [Q laughs]
A: You know, which I don’t know how many people had a thing for the state. I think every site but one had like, you know— and it’s like if you’re in the neighborhood you don’t go around saying like, ‘oh that’s 10301!’ You say like ‘oh, they’re in New Dorp Beach’ or you know like ‘they’re down by like Egbert Lane.’ or like you don’t really like, think in these kind of like—
Q: Zip code form fields that are inherited–
A: Yeah! [A laughs]
Q: There it is. Yeah. Yeah, yeah.
A: And maybe everyone’s like in the same zip code or two zip codes or something.
Q: Yeah.
A: But, you know there were kind of these like little things that were you know— or just the date. Like come on, put the date [A laughs].
Q: Right, yeah. I talked to someone else who was like a lot of people paid attention to spatial data, but the temporal data was nowhere. Like no one had any idea if it was a follow-up from a previous—like you just couldn’t tell.
A: Yeah.
Q: Cause there was no date. Yeah.
A: And then when they put the two fields in the same—you sometimes you don’t know is that a first name or is that a last name, or you know it can— you know and it’s just like these little things. They just seem so obvious, but you know they’re—they can be overlooked. They seem obvious when you’re entering the data and trying to report on it [A laughs]. But otherwise they don’t seem obvious.
Q: When you’re in front of a person at their door. Yeah. Yeah.
A: But back to inequality.
Q: Yeah, yeah. So that’s sort of part of the larger question where by, I’m really interested in what the data makes apparent— because in retrospect you have the data and you don’t have a lot of other stuff, and so the data’s responsible in a lot of ways of showing what a disaster looks like. Even though, like you said, a bunch of things are missing and there’s a bunch in the junk folder and all this sort of stuff is happening, and so one of the questions is like what do you think the data makes apparent and how might that differ from what’s happening on the ground? And then the second part of that— well maybe we’ll start there.
A: Well what do you mean by how it makes it different from what’s on the ground?
Q: So, so like I said you’re going door to door, things are messy, it generates a bunch of junk that didn’t get standardized that might’ve been important when someone was having a conversation cause there was a baby, but—
A: Okay. Yeah, yeah.
Q: But then it doesn’t— because it can’t get standardized or because it was— it wasn’t in other areas or something it gets, it gets—
A: Yeah.
Q: Left out.
A: Lost in translation kind of thing.
Q: Yeah, yeah. So, so what do you think some of those things are, and do you think that a, a disaster— what it looks like from the data is, is different from a disaster on the ground? What those things might look like.
A: Well ideally it shouldn’t. Right?
Q: Right.
A: But I think— one thing’s obvious is the level of unmet need and just—
Q: The level of what, sorry?
A: Unmet needs.
Q: Oh unmet needs.
A: Like, you know, basic like food, cleaning products, people to help like with reconstruction, mold issues. I mean they’re obviously there and there’s a lot of them. But because of the variability and how they’re reported, kind of deriving some kind of signal, like the— you know the signal’s being lost, because you know it’s different granularities.. Because if you’re standing there and asking people like all—you know maybe having all of the legal issues and all of that is maybe like a day or two after the storm isn’t necessarily when you want to be recording that, but maybe you know maybe a few weeks later when they have their, you know, claim rejected from the insurance company… So that was another— I think the places I know Rockaways had this, but where when legal was there, you could see that it was being used. But some of the— I don’t think all of the hubs had that type of, were asking that type of information. But maybe it’s because they didn’t have the people to help fill, you know—if you know, if you know people have legal problems but you can’t help them, it’s really not useful to know that right? [laughter]
Q: Right.
A: Better focus on other things.
Q: Okay.
A: But I kind of think though that if the—I mean ideally I would see the form as an actual something to be used in a feedback loop like— you know if you can canvass your population and see that certain things are outstanding, it can help prioritize the distribution of resources in that site and perhaps among, you know— like on Staten Island there were several sites, you know at various points, but maybe if say there’s— I don’t know maybe there’s a generous lawyer that’s willing to give pro bono services and he comes to Midland Beach, but he’s not really that needed but maybe they need him, you know somewhere else, you can— you know it helps information, useful information, to travel quicker and potentially, and support more informed service provision. That’s what I would see in an ideal world. But I kind of think that— my feeling is that that couldn’t have been done in an environment with so much uncertainty and with limited time and resources.
Q: Hmm. Okay. So two of the frames that people are looking at Sandy in terms of like moving forward – one is climate change and one is inequity. And so let’s start with— let’s start with inequity. So if you could talk about some of your— in terms of race, gender, and class. Those are the, those are the categories—and age to some extent. First, what about your experience on the ground, like seeing or not seeing some of that inequity, and then secondly, how do you think your data is able or unable to reflect some of those queries that might be asked of it.
A: Well I can say that I think the area of Staten Island that was the most affected and still unable to recover is more mixed racially and poorer that other areas that were impacted Great Kills and south. Although still pretty white, there are more immigrants, blacks and Latinos. Neglect of one of the communites, New Dorp Beach, was obvious. Despite the promise of a Red Cross vehicle and showers in Miller Field immediately post-Sandy they were late to come and didn’t have a real presence until after the snow. Many in this area were without heat and hot water. Further down the beach area got hit too, but this is like where you see like million dollar homes and stuff like people’s boats were on the street. Like come on. Whereas these people like they have no— they’re like digging through these you know cardboard boxes for you know toilet paper and you know clothes and— so and I don’t think the data really captures that. Definitely I mean I don’t see anything on– that I can think of from—I mean I, I would think maybe in relation, so I mean you have needs documented, but you can’t really say that those needs are related to… you know—
Q: Significant differences in population?
A: Yeah, yeah. I mean it could just be — I don’t know — it would be hard to kind of piece that together. I think that most of the medical issues though, like a lot of them would ask about like ‘is there a senior living in your house?’ or something like that. So some of that is I think a little bit more— I even remember like one of the easier statistics we were able to get at is, I don’t know, x percent of people that needed, indicated medical need and had a senior in their home. I also— some of them recorded homebound, so I mean that’s typically something you would refer to as like an older person.
How do you pin—how can you even— it’s not something that just happened that day. How do you slowly build a picture through information that need, can be pieced together that —and I would’ve loved for the like the canvassing data to like say, ‘certain areas needed more’ and be like, if certain areas had more substantial unmet need than other areas, but you can’t really. So I would be afraid of making any sort of like strong statements about you know any of the findings.
Q: Hmm. What, what do you think the difference between infographics and like meaningful statistics are?
Q: Right.
Q: Mhmm, mhmm. My students cite infographics, but.. [Q laughs].
A: Ah really?
Q: Yes.
A: Then maybe I’m wrong.
Q: Was, is, yeah. It’s—
Q: Mhmm. Okay so let’s move— oh, what about gender? Was gender a part of the data?
A: I think they indicated— I mean I don’t even know, to tell you the truth.
Q: Okay
A: I mean it’s—I’m trying to even think if I remember seeing that as a field. Well you know what it was, most people didn’t— they would report a person’s name and then how many people were in the household. And I forget even, like Red Hook called them ‘projects’. So each, each like “house” was essentially a project. So it wasn’t really on— I, I think you know if you thought of a database it wasn’t like these instances were people, they were more like a residence.
Q: Okay. Got it. Okay so climate change. So a lot of people are talking about this storm as one instance of a larger set of instances that we’re going to have because of climate change and you’re nodding you’re like ‘yes’ that is probably the case?
A: Well I don’t know if it’s climate change.
Q: Okay
A: But I, I [A laughs] actually think a lot of it is— so you know a lot of these areas were estuaries at one point, and you know people have been talking about like eutrophication and, and things like the Rockaways is essentially a sandbar. And then there were all these reefs along Staten Island, which I read were essentially to— destructed for building purposes, so I mean I’m— but I do think that. Well, I know just from living here it’s kind [A laughs] of like warmer and warmer, so I used to— my grandmother loved camellias, and when she was alive I always wanted to you know I was a kid I didn’t know any better I was like, ‘oh yeah, oh I want to buy you a camellia,’ but they don’t grow up— they didn’t grow up in this zone, they—they were like right on the border. But now, you can have like there’s no problem you know like kind of the zones change. I mean very little, but, so I think maybe that compounded with some of this building out, and you know. I know that there were some issues with, you know, this like nutrient pollution that was going on over in Jamaica Bay and you know. So I think a lot of the things in, maybe that Mother Nature created that could’ve prevented some of this—I mean, I don’t know about prevented, but maybe reduce the impact? You know, that they’re not in place, but…
Q: So, so regardless of maybe what the cause is, whether you want to say Mother Nature, however you want to attribute what’s going on, how— do you think you’re— so a lot of people are talking about forward thinking like, mitigation of future, cause if, if, if we’re having more and more extreme weather events for whatever reason, right, we’re assuming that they’ll be and this is one of our first big— well, Irene was the first one, this is the second one, and those happened very close together relative to the one that happened before that which like, I don’t even know what it was, right? So looking forward, what are the sort of things you think we can do either in terms of data or infrastructure or other sorts of things, and do you think the data can help us figure out what some of that might be— right: prevention for the future.
A: Well I do think that there’s definitely best practices that can be learned from looking at the data, and I don’t think those best practices are what it—I think what actually isn’t in the data, you know. It’s what— you know if you think of what the, you know all of this data that could’ve been generated what you know, or was generated and it just wasn’t collected or captured in a way to inform decision-making at hubs or analysis. I think for advocacy and I wouldn’t I, I don’t doubt that— well I know in Red Hook I think there’s some issues with like people thought with chemicals and leaching and things like that, and I know I had heard a little bit about people wanting to like ‘how do I do water testing’ and all of, you know. We just—there was nothing there to kind of like be proactive about that type of thing. Or even be aware of what the long-term repercussions of not doing that are. But yeah, I guess in terms of the data I think data can be used to advocate for people and also to—I think that it could point at something. Like if there was inequality, if you see disparities in the data, you can find correlations, and you know, perhaps some basis for causal inference or, but, it’s you know. And I, I actually think if just a simple data standard could’ve done that, and that could’ve been just some basic demographics, and then like— well, I also think it changes. Like what if it’s winter next time, and it’s not you know so— or, or I mean it’s summer. No one’s going to be asking about like, ‘oh do you need electricity?’ or you know something I think, and I think it’s like an art, like something that’s structured enough to be meaningful, but also flexible enough to expand to meet the environment— whatever is triggering the use of that form. And maybe that just means fleshing out broad conceptual areas where, you know, these types of — maybe you might want to assess what’s going on with like the elderly, or you know maybe you might want to take some— and I think though people are like— no one wants to tell somebody that it’s coming to their house [Q: Yeah, yeah.], like how much money they make or… But maybe pairing that with like census data or things something like or you know that can help.
Q: Mhmm. How do you think— well. So how do you think that social media might generate some of the data you guys are looking at or the role that it played in what you were doing.
A: Yeah, no, I don’t think it will— I mean I don’t think it will be useful for that. I don’t think that they have that much information. And I was even thinking like something like Occupy Sandy— nobody starting calling it Occupy Sandy like, like that name—
Q: Until later in the game.
A: Yeah, so. And I can’t record, tweet— you know there’s only so much space [A laughs] you know, so. But I think that maybe — you know I actually think that some, maybe some of what’s meaningful, what one could get out of social media is like multi- you know using multimedia inference. So textual things, paired with images— because I don’t think any one of these sources has that much meaning in their own, I kind of think there’s a lot of noise in social media, but I do think that—I think images will be, would be useful. But the thing is I think, I don’t know what the life for, for immediately post Sandy. Or then just maybe some of the like, you know, things that were like homes destroyed and you know, people were definitely taking pictures, but also a good photographer might have that at a later point in time. But like say some of these pictures where people are being airlifted out of like you know their home in Midland Beach and stuff, like, those pictures you can’t find the links to anymore.
Q: Hmm, interesting.
A:
Q: It’s something like fourteen or seven or one or two weeks, yeah.
A:
Q: Yeah. Although the Library of Congress is supposed to be archiving all tweets ever.
A: I heard, I heard.
Q: It’s just that, you just can’t get them yet.
A: But I don’t know. I’m wondering though, are they going to archive the associated image, like, associated media.
Q: Right.
A: Which I kind of think— I kind of think the visual aspect of things is very important, because I’m not going to write out the details of—like if somebody, something’s shocking to me that I see, I’m probably going to take a picture and then maybe write something that actually relates to this image and, you know. Are you guys doing anything with the social media?
Q: We’re trying to. Right, because we—you can do discourse analysis even like just to see which words are most used to describe something and how they trend over time in relation to what.. Even very basically is something we can see and same with image –visual culture sort of analysis, right. We can do that, too. The problem is that we don’t all have the data mining skills to go back and find those things or like— so we’re trying to partner with other people, so I’m very interested in your tweets. And things like that so that, because we have the ability to, to mine them, but not always the ability to capture them, right. Depending on what our skill sets are. We only—we have one guy who specializes in social media in the group, and he’s been trying to capture mostly news stories. So. Yeah.
A: Yeah well let me know. Because I mean I think I could even point you to some other people that might be interested. But just so you know it’s like one day previous to three days aft— so it’s like a four day window.
Q: So like the 28th 29th 30th 31st?
A: Yeah. Yeah so maybe and maybe the 1st of November, you know depending—
Q: Right.
A: Yeah it’s just a—
Q: Perfect, yeah, great. And that you’re I know you’re not tracking them later those are, that’s just the, the immediate—
A: Yeah, that was it.
Q: Yeah. Okay. So how do you think—one of the things we’re asking people about is what is when they think sort of recovery will be over or when the crisis is over, anything like that. Do you have any ideas about that or do your data have any ideas about that?
A: Well I mean I will say in terms of data the— so there’s definitely– there’s a lot less being generated. Like even in the Google forms. I think the only thing that’s really up— I think the only thing that might be updated at all is some of the food kitchen stuff, which I think somebody even said they stopped that, but I’m pretty sure I saw somebody like update that, but and then—
Q: Because the food kitchens are still running, but—
A: I don’t— I thought that they were closed.
Q: Okay.
A: But somebody— I don’t know maybe there’s like—I don’t know, maybe there’s an informal network or I, I really don’t know. But I should say that’s the only documents I’ve seen activity on, so, but canvassing still goes on on Staten Island. I think that they just gave us what they have, you know collected, what they had. You know, it’s not like we have an incoming stream. So Rockaways closed down, I know that. So there’s definitely less data. But I don’t think the crisis—I mean the crisis it— it’s inherent to everything. I don’t think— I think this is the crisis and it’s not going to end if it’s even a crisis—I don’t know, it’s just a situation [A laughs]. I mean, especially with our recent, our mayor and everything I think things are just getting worse. Maybe the next episode I think is a way to kind of you know, but I think the crisis is here to stay [A Laughs].
Q: This—that’s the sort of response that we get from most people who work on the ground.
A: Oh, okay.
Q: While in government, people tend to say “May 1st,” right? And so teasing out some of that difference has been really interesting in ways of how people are thinking. Like when they think crisis, they think the storm like the rain and, and sort of other people in the crisis are the needs and those needs exist before the storm and continue after the storm so it’s been very interesting to hear differences in that and it almost ubiquitously, like people who work on the ground and people who are activists are like [Q laughs] it’s not over it’s never going to be over, it was started before the storm— so that’s super interesting. So you follow the script [Q laughs].
A: That’s good to know that other people say that, too.
Q: Yeah.
A: So I don’t feel like a pessimist or something [A laughs].
Q: Yeah. What’s, well it’s interesting that the data isn’t still being kept up sort of in that spirit, right? That if this is an ongoing crisis, don’t we need more data for that ongoing crisis?
Q: Monitoring particulates, yes, [A: Oh, okay.] but as far as, but, but—
A: What about water?
Q: The DEP is responsible—they— in New York City there’s an average of one water test per minute because New York City doesn’t have filtered water, so that there’s always been a tight regime over that, but I don’t know what the distribution of their sampling is, whether they’ve stepped it up in these areas or not, because of ground contamination.
Q: I think after a certain time like, you might be able to get some of that from the public record from hospitals, like after their quarter or after their—
A: Yeah, I think that’s what—I think they report this every quarter.
Q: Yeah.
A: But I think— I wonder if you could just get it for the entire quarter, but you know, even the spike in activity.
Q: Yeah. I’ve seen people who research disasters –like that’s all they do– they have that information when they’re number crunching. Like they have the number of emergency room admittances per day. Like Katrina— a lot of Katrina stuff has this, this sort of breakdown, so you can get it somehow. I’m not sure how, but—
A: Well this, this is also, I think, would be interesting to talk about on Sunday—not this Sunday, next one— like, what is it that, what you know. Because it’s one thing to just make charts and graphs or whatever, but, so that this could actually be useful for advocacy or like informing civic action or you know kind of things that people could use as type of like leverage or whatever. Like what is useful. Like what is out there and what is useful to collect versus just collecting everything including the kitchen sink, or you know, collecting nothing. So hopefully you’ll have some idea to that [A laughs].
Q: Yeah. Yeah, yeah. Sources. Let’s see, one of the last things, you mention granularity a few times about your data, and you mention scale once. And where I come from those are the same, those are part of the same thing. So I was wondering if you talk about a little bit about scale in the data and how that might be a point of tension or something that’s happening in the data.
A: Where did, what did I say in relation to scale?
Q: You said that there were, it was one of the list you make. There are different scales, there are different granularities, there are different—
A: Oh okay. Like, I think one actually— I think it was New Jersey that asked. Yeah it was New Jersey. Certain needs to rate them from like you know [Q: Oh, okay.] one of these Likert scales, which actually [A laughs] somebody later pointed out well what is really— what are the extremes of the scale? Like it didn’t sort of tell you was like— were supposed to go from like one is low— does that mean top priority or low, low need?
Q: Right [Q laughs]
A: So that wasn’t even on the form.
Q: Right, oops.
A: Which maybe that was in the orientation or [A laughs] I don’t know. But it’s kind of, you know, sometimes I can space out during an orientation it’s nice to have that there. But I guess in terms of granularity, I just think that some of these— well, each site has— I guess I mean how closely you’re going to look at some particular phenomena, like the resolution in a way.
Q: We have partnered with people who are like ‘can you guys take a look at this survey’ and we look at it and are like ‘whoa, whoa, whoa [A laughs] okay.’ But that doesn’t happen, that happened late in the game, it didn’t happen very often. But yeah, yeah, it’s true.
Do you think that this storm and maybe looking at this data has changed how you see New York City? Or how you understand New York City?
A: [long pause] No. [laughs]. I mean it makes me a little irritated, but no. [Laughs]
Q: Okay. Is there any question that you think I should’ve asked that I didn’t ask? Any sort of interesting things that you’ve come up that I didn’t hit on?
A: I’m trying to think back to the last question about if it’s changed…[laugh]. Well I, I should say that I think there’s a little more cohesiveness in terms of informal structures than, than I think I’ve seen before.
Q: What do you mean by informal structures?
A: Oh, I mean not like necessarily like, you know, some not for profit organization or you know some government organization stepping in.
Q: Meaning like social networks or?
A: Yeah, maybe like social networks. Cause like one thing I was surprised— so I, I was on this New Dorp Beach Facebook site and, you know, they’re talking about writing a letter and blah, blah, blah, and I was just like, well I, I forget how this came up, but it turned into—like we wanted to get money for something or whatever. Like maybe it was like a grant or something, and we—they were like—you were more likely to get it if you had like an organization with 501X status sponsor it. [A laughs] And these guy started getting sponsor it– like some motorcycle club in Bay Ridge [laughs]. So that sort of stuff just blows my mind that, you know, this is kind of what all brought us together, you know. So I mean that what, that kind of—I sort of think that ethnicities have helped to keep in their own little silo and you know. And I should say that, so I’m from Staten Island and we always get ragged on, so if anything it was nice to see people actually like stick up for Staten Island [laughs]. So I should say this is probably the most. I’d say the last year has probably been the best facelift Staten Island has received [laughs]—
Q: Too bad it had to come around this way.
A: Yes, yeah.
Q: Yeah. Do you have any questions for me? Any things come up?
A: Yeah, so I mean do you have any advice for like, I guess or, or ideas for what we might be able to do with what we have or—
Q: Well I haven’t seen what you guys have—that’s part of why I’m coming to the yackathon, trying to sort of see what else is going on. One other thing I am interested in doing is seeing what kind of data might, like you say like, how you can go from data to activism, right? I’m interested in seeing how, how that can happen, how that can be used to sort of identify priority places to intervene and what those interventions might be— particularly how they might run against, sort of, intuitive ideas of what’s going on cause a lot of our intuitive ideas are inherited from like government and things that didn’t do so hot during the storm. And I’m interested in yeah, like putting together a best practices, like “next storm” or “next crisis here are the things that need to be met and you meet them however you need,” because we just learned that grassroots, localized methods of putting things together are far more successful than top-down sort of— I mean that we have that in abundance in our data already. So how can you take those lessons and put them into the data world or put them into the canvassing world or something like that. Yeah, those sorts of things. Other things— I’m interested in seeing what might come out of the data from long—like even though your data isn’t meant to be long-term, right, it’s all about, you know, immediate needs, health and safety, following the storm, I’m interested in seeing how those may or may not extrapolate into longer term trends where we can talk about, you know, the storm as a punctuation mark over this longer crisis and how might the data support that.
A: Well most of the— I think the data we have is not immediately post storm. I don’t I think that people did collect— I think Rockaways was one of the few places. And I remember when you know she had given me the form, we were talking about like medical needs like she was like, ‘this set—this, these were like the older ones and, and there’s definitely more stuff in there about, like you know, this particular time’ and you know ‘a lot of these Google forms and things like that weren’t this was like weeks, months later.’ I kind of think what was happening immediately post storm was just all you know, people that were dedicated, knew what was going on, knew who needed what— even this woman in New Jersey— this was only like a month ago. She still works off the paper forms, which means, says to me, she must like know— she must be familiar with these people— like could you, would you imagine like having to riffle through all of these forms all the time? Like there must’ve been two hundred forms there. But she knows like she’s familiar with what’s going on and what cases still you know—
Q: Are still open and—
A: Yeah.
Q: Okay. Yeah.
A: So it’s kind of like in some ways I don’t know— I don’t know if these people need the forms like the people collecting the— that want to analyze the data later—like they need [A laughs].
Q: Right, maybe two different things.
Q: Okay.
A: I’ll let you— I’ll just say one more thing.
Q: Yeah.
A: So one thing I found interesting is, I kind of think that there’s a lot of –and it just disappoints me that so many people have personal issues, there’s just a lot of petty squabbling. I’ve seen so many people ripped apart on listserves, and it’s like just, everyone’s here for a good reason. Like, it’s coming from the right place. Why do we have to bring the things that we hate or the things like, why do we have to bring these things into that arena? I kind of think that people are stressed, it’s easy to like have those issues with coping and, you know if you’re seeing horrible things or I don’t know. But you’re disappointed in what you see, and rather than tell—kind of like backlash on other people [both laugh] I kind of think like something in this best practices should be about this kind of—I don’t know what it is, maybe like psycho-social support for other activists or something like that, because I do think it’s like shooting yourself in the foot in a way. [laughs]
Q: Yeah. Great. Well thanks so much—
[recording ends]
Occupy Sandy Open Data is here.
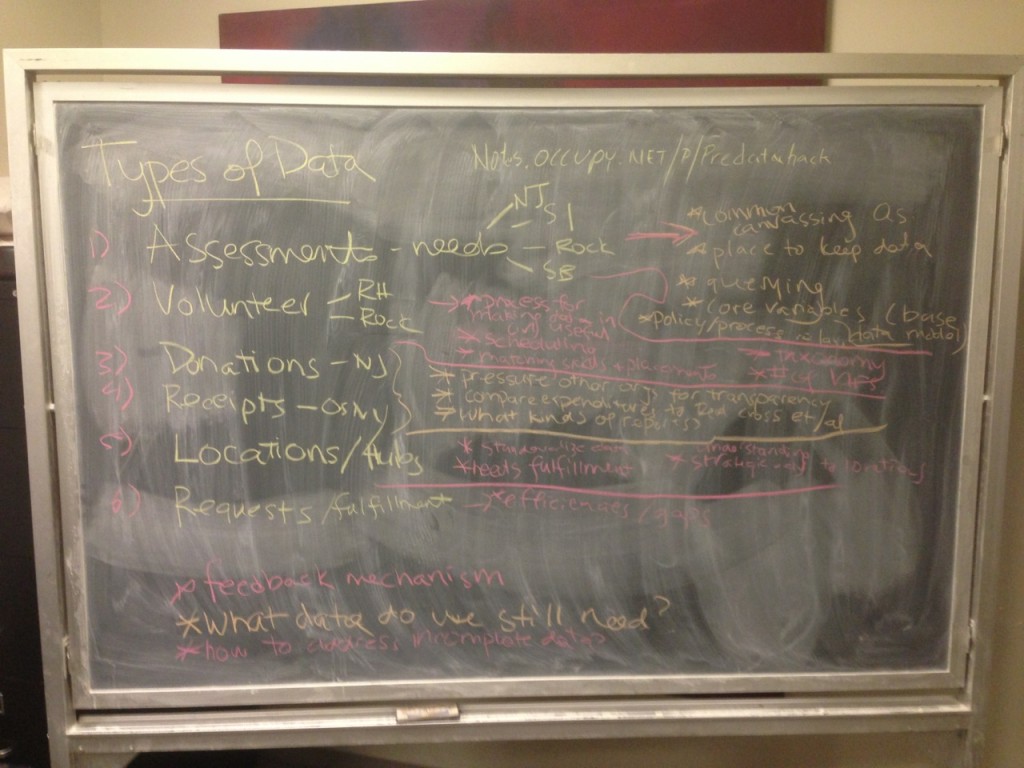
Blackboard from Occupy Data hackathon on Sandy data. Photo from occupydatanyc.org
This work is licensed under a Creative Commons Attribution-ShareAlike 3.0 Unported License. This data may be shared, copied, distributed and used free of charge provided you attribute the source of the data to Superstorm Research Lab within the work you produce.If you alter, transform, or build upon this work, you may distribute the resulting work only under the same or similar license to this one (Creative Commons, CopyLeft, or Open Source), meaning the work must remain free, open, and the data must be attributed to SRL. www.superstormresearchlab.org. An example of this attribution is available below. Members of SRL are co-owners of this Creative Commons license. Any of the above conditions can be waived if you get permission from SRL.
Example Attribution: “Interviews [for your project] was collected by the Superstorm Research Lab, a mutual aid research collective. For more information on how this data was obtained, see www.superstormresearchlab.org.”


